

Most organisations measure who finished the training. Very few measure what changed because of it. That gap between completing a module and recognising a real threat is where security awareness training effectiveness is either proven or isn’t.
Key Takeaways
- Completion rates confirm that training happened they do not confirm that behaviour changed. They are a compliance metric, not an effectiveness metric.
- At 6–12 months, a well-run programme should show a 40–80% reduction in simulated phishing click rates, alongside measurable growth in real-world threat reporting.
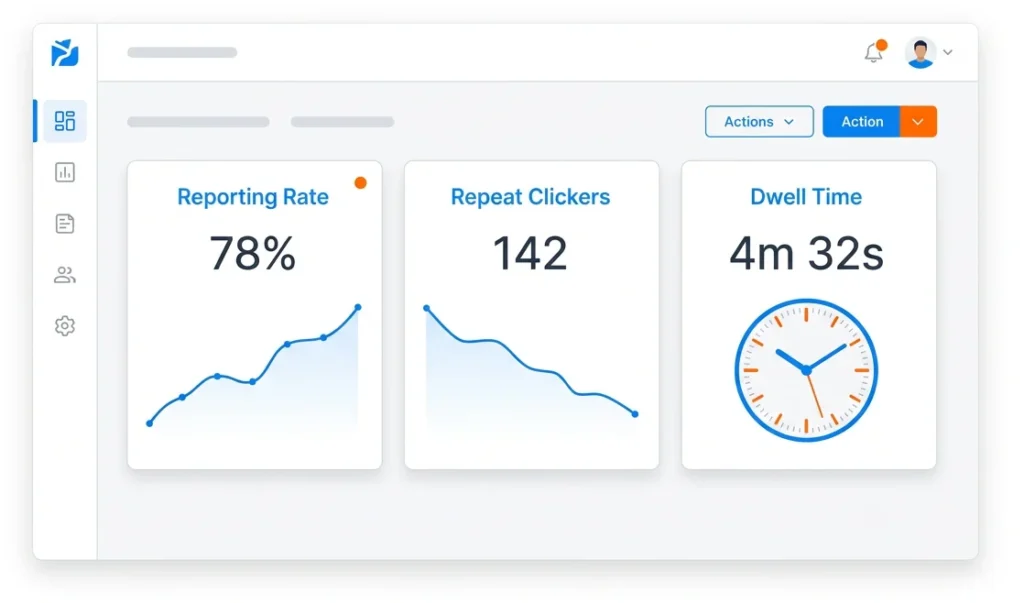
- Seven specific metrics including real-world reporting rate, repeat-clicker reduction, and dwell time give you data that holds up to leadership scrutiny.
- Some training designs are genuinely ineffective. A 2025 large-scale controlled study found no statistically significant training effect on click rates. Understanding why matters for interpreting your own results.
- Individual-level tracking has GDPR and employment law implications. EU and UK organisations should review their data protection obligations before scaling measurement.
Measuring the effectiveness of security awareness training means tracking whether employee behaviour changes in real threat situations not only in controlled simulations. The most useful metrics capture reporting rates, repeat-clicker patterns, and incident trends over time. A 2025 industry benchmarking report covering 67.7 million simulated phishing tests found that organisations with consistent, sustained training reduced employee phishing susceptibility by 86% over 12 months. But that figure only tells part of the story. If your programme is 6–12 months old, this article tells you what your data should look like right now and which metrics will hold up when leadership asks whether the investment is worth continuing.
What Are Most Security Awareness Metrics Actually Measuring?
The two most common metrics in security awareness training programmes are completion rates and simulated phishing click rates. Both have real limitations.
Completion rates confirm that training happened. They satisfy audit requirements. What they do not confirm is that anyone learned anything useful or changed how they behave when a real threat arrives. Updated federal cybersecurity guidance published in September 2024 states this directly: completion logs satisfy compliance requirements but do not prove risk reduction. Using completion rates as a primary KPI is a category error it measures activity, not outcome.
Simulated click rates are more useful, but only if you control for simulation difficulty. A 15% click rate on a highly convincing, contextually relevant phishing email means something very different from 15% on an obvious generic scam. Research published in 2025 confirmed that click rates increased from 7% on easy phishing lures to 15% on harder ones, even among trained employees. Without difficulty calibration, comparing click rates between campaigns tells you almost nothing reliable.
The practical result of relying on these two metrics is a measurement gap that most programme owners recognise, the dashboard looks fine, but nothing feels proven. Closing that gap is exactly what measuring security awareness training effectiveness is designed to do..
What Results Should You See at 6–12 Months Into Your Programme?
This is the question that most published guides avoid. Benchmarks exist but they are rarely translated into month-by-month expectations for programmes already underway.
The 90-Day Marker
According to a 2025 industry benchmarking report drawing on data from 14.5 million users across 62,400 organisations, the global baseline phish-prone percentage before training is 33.1%. After 90 days of consistent training and simulated phishing, the average reduction is approximately 40%.
If your programme is around three months in and click rates have dropped by 30–45% from your pre-training baseline, you are on track. If they haven’t moved, the issue is likely one of three things: inconsistent simulation frequency, training content that isn’t behaviour-focused, or employees who have disengaged because the programme feels like surveillance rather than support.
Months 6–12: What “On Track” Looks Like
That same benchmarking data shows average phish-prone rates falling to 4.1% by month 12 an 86% reduction from the pre-training baseline. That is the 12-month destination. At month six, a realistic midpoint target is a 60–70% reduction from your own starting point.
More important than the click-rate number is what is happening with reporting behaviour. Are employees actively flagging suspicious emails or just avoiding the ones they recognise? A 2024 data breach study found that in phishing simulation exercises, 20% of users identified and reported a suspicious email without clicking first. That is the shift that signals a genuine change in how your people respond to threats.
Which 7 Metrics Prove the Effectiveness of Security Awareness Training?
Each metric below includes what it measures, a realistic target for months 6–12, and how to collect it. Taken together, these seven give you a picture of your programme that completion rates and click rates alone cannot provide.
1. Phishing Reporting Rate (Simulation)
What it measures: The percentage of employees who actively report a simulated phishing email rather than ignoring or deleting it.
Target at 6–12 months: 20–35% reporting rate. Not every employee will report every simulation and that is expected. A consistent upward trend matters more than the absolute number.
How to collect it: Your phishing simulation platform logs reports automatically. Track this monthly, not quarterly. Monthly tracking lets you catch dips early.
2. Real-World Threat Reporting Rate
What it measures: How often employees report actual suspicious emails through your official reporting channel as opposed to deleting them, ignoring them, or handling them alone.
Why it matters: Simulation performance and real-world behaviour are not the same thing. A 2024 data breach study found that 11% of employees who clicked a phishing link in a simulation also reported it. That overlap is a meaningful behavioural signal but it only becomes visible if you are measuring real-world reports separately from simulation outcomes.
Target at 6–12 months: Consistent month-on-month growth in real-world report volume. Even a 10–15% monthly increase indicates that the training is transferring to daily behaviour.
3. Repeat-Clicker Reduction Rate
What it measures: The percentage of employees who clicked on more than one simulated phishing email in a 12-month period and how that number changes as the programme progresses.
Why it matters: In most organizations, a small cohort accounts for a disproportionate share of human-layer risk. Identifying that group and intervening specifically rather than rerunning the same training for everyone is where repeat-clicker tracking earns its place.
Target at 6–12 months: A 40–60% reduction in your repeat-clicker cohort compared to your programme baseline. . If the number is not moving, the format of the intervention not the employees likely needs to change.
4. Average Time to Report (Dwell Time)
What it measures: How long it takes, on average, from when a suspicious email arrives to when an employee reports it.
Why it matters: Speed matters in limiting breach damage. A 2024 data breach study found that the median time from a phishing email arriving to a user clicking a malicious link is just 21 seconds. The shorter the reporting window, the less time an attacker has to operate.
Target at 6–12 months: A measurable reduction in average reporting time compared to your programme’s starting point. Establish a specific baseline in month one. Without a baseline, you have nothing to compare against.
5. Knowledge Assessment Score Trend
What it measures: Whether employee scores on post-training assessments are improving over time not simply whether they completed the module.
The important distinction: This is a learning retention metric, not a completion metric. The question is not “did they finish?” it is “do they score higher at month six than they did at month one?”
Target at 6–12 months: A consistent upward trend across assessment cohorts. Flat or declining scores indicate that training content is not landing and that completing modules is not the same as absorbing them.
6. Security Incident Frequency Trend
What it measures: The number of security incidents attributable to human error over time phishing clicks on real emails, credential sharing, accidental data exposure.
Why it matters: This is your lagging indicator and your most powerful one. According to a 2024 data breach study, 68% of confirmed breaches involved a non-malicious human element. A downward trend in human-error incidents connects your awareness programme directly to operational risk reduction. That is the argument leadership needs.
Target at 6–12 months: A visible downward trend. Even a 15–20% reduction at this stage is a meaningful and credible result.
7. Miss Rate
What it measures: The percentage of employees who neither click on nor report a simulated phishing email they do nothing at all.
Why it matters: This is the hidden risk in most SAT dashboards. An employee who ignores a phishing simulation has not necessarily recognised it. They may have been too busy, felt unsure how to report, or simply not seen it. A high miss rate can mask a low-reporting culture that looks, on the surface, like a low-risk one.
Target at 6–12 months: Below 50%. If more than half your employees are doing nothing with simulated phishing emails, your reporting process not your training content needs attention first.
Does Research Actually Support Security Awareness Training?
This question is worth answering directly, because the evidence is more mixed than most vendor-produced content acknowledges.
A 2025 large-scale controlled study involving 12,511 employees at a US-based financial technology firm found that training interventions had no statistically significant effect on phishing click rates (p = 0.450) or on reporting rates (p = 0.417). These results are not an outlier. A separate long-term study covering more than 14,000 employees over 15 months found that mandatory follow-up training provided no additional benefit for the employees most susceptible to phishing precisely the people it was designed to help.
These findings do not mean security awareness training cannot work. They mean that passive, infrequent, compliance-driven training largely does not work. The difference between a programme that fails and one that actually improves security awareness training effectiveness comes down to three things: how often it runs, how relevant it feels to the person receiving it, and whether feedback is immediate not just what content it contains.
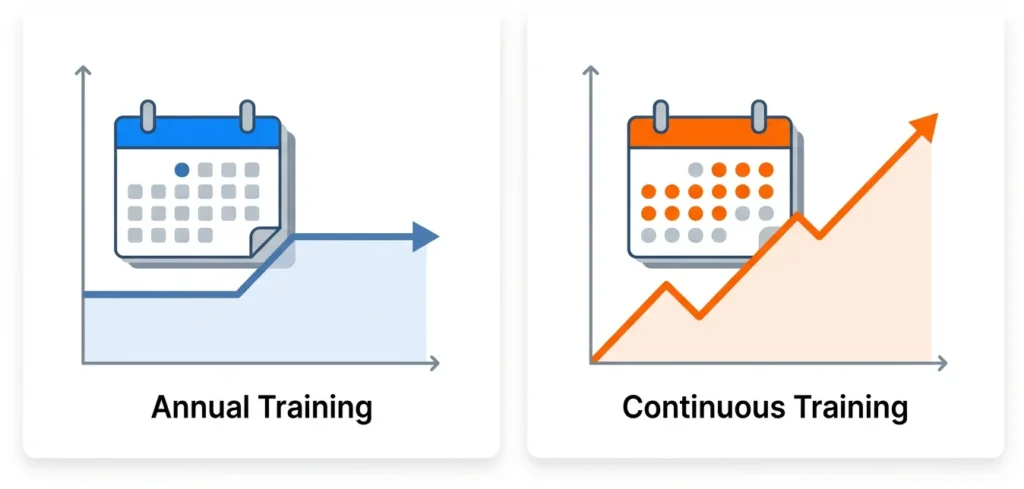
The contrast is clear: a study covering 20 organisations and more than 1,300 employees found that sustained, continuous simulation programmes halved successful phishing compromise rates within six months. The pattern holds across multiple studies frequency, personalisation, and immediate feedback are what produce measurable change. One-off annual training, delivered primarily to satisfy an audit requirement, rarely does.
This distinction matters directly for interpreting your own data. If your programme is still annual in format, your current metrics may be accurately reflecting a programme that is not designed to change behaviour in a lasting way. That is useful to know and honest to acknowledge when presenting your results.
How Do You Turn These Metrics Into a Leadership Presentation?

Seven metrics are only valuable if they are communicated in language leadership can act on. Here is a framework for a five-minute presentation.
Open with the financial exposure. According to a 2025 cost-of-breach report, the global average cost of a data breach is $4.44 million. Research from an earlier edition of the same report found that employee training was associated with an average breach cost reduction of $232,867 per incident. That is your framing not the training budget, but the risk it is managing.
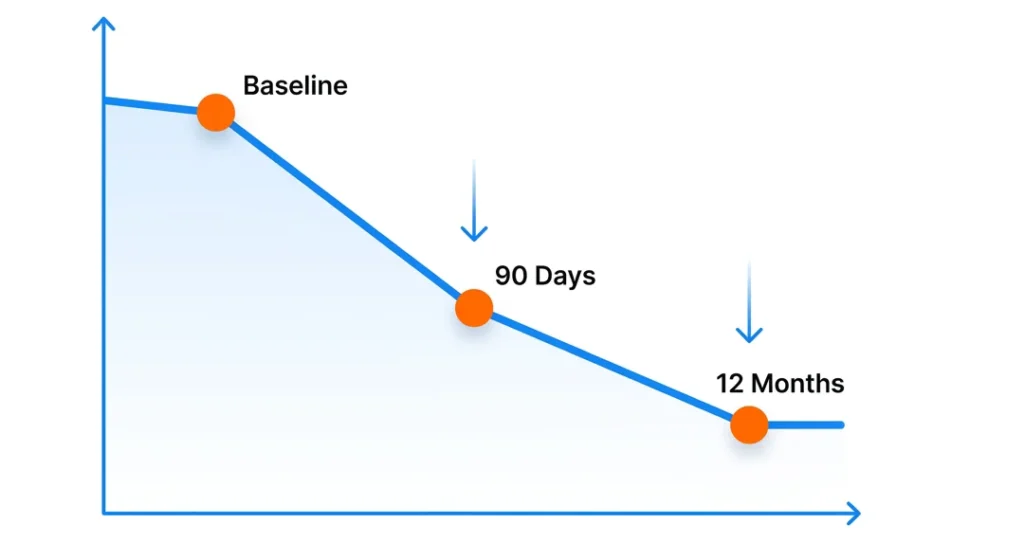
Show the curve, not a snapshot. Present three data points: your baseline at programme start, your 90-day result, and your current result. A downward click-rate trend alongside an upward reporting-rate trend tells a story. A single number tells leadership nothing they can reason about.
Use business language for the outcome. Not “our phish-prone percentage dropped 42%.” Instead: “Fewer employees are falling for test attacks, more are actively flagging real suspicious emails, and the group at highest repeat-risk has shrunk by 40%.”
Include one honest caveat. Leadership trusts data more when it has been interpreted with visible rigour. Acknowledging that simulated click rates are an imperfect measure but that real-world reporting trends confirm the direction positions you as credible rather than promotional.
Platforms like Complorer are built specifically for this kind of reporting combining simulation data, real-world reporting metrics, and programme analytics so that programme owners can produce evidence that holds up in a budget conversation, not just in a dashboard.
What Are the GDPR Implications of Tracking Individual Behaviour?
If your program tracks individual employee behavior over time, it may raise GDPR and UK GDPR issues around employee monitoring, transparency, lawful basis, and proportionality.
This is not a reason to stop measuring at the individual level. It is a reason to do so responsibly. Before scaling individual-level tracking, organisations in the EU and UK should check several things: whether a Data Protection Impact Assessment (DPIA) has been completed for the programme, whether employees have been informed that their simulation responses are logged, and what the lawful basis for processing that data is.
The NIS2 Directive, effective in EU member states since October 2024, has added further compliance complexity for organisations in regulated sectors. If you have not reviewed your data protection position on individual-level SAT measurement, consult your data protection officer or legal counsel before proceeding.
This is a matter of responsible programme design and, separately, of legal exposure. Neither concern is theoretical.
How to Act on Your Security Awareness Training Effectiveness Data?
Your security awareness training programme is 6–12 months old. You now have seven specific metrics to track and a realistic picture of what your data should look like at this point.
Three things to act on this week: first, replace completion rate as your primary KPI with phishing reporting rate and real-world threat reporting rate these measure what actually matters. Second, check whether your programme is running continuously or still annual in format the evidence is unambiguous that frequency determines whether training changes behaviour. Third, build your leadership presentation around risk reduction, not activity. The breach-cost data gives you a credible financial frame that survives scrutiny.
If you want a platform built around measuring what your current tools may not, Complorer brings simulation data, real-world reporting, and programme analytics together in one place designed for teams that need evidence, not dashboards.
Book a 20-minute walkthrough to see how Complorer measures what your current platform doesn’t.
Frequently Asked Questions
What is the most important metric for security awareness training effectiveness?
When evaluating security awareness training effectiveness, the most important single metric is the real-world threat reporting rate how often employees report actual suspicious emails, not just simulated ones.
What phishing click rate should we expect after 12 months of training?
According to a 2025 industry benchmarking report covering 67.7 million simulated phishing tests, organisations with consistent training programmes reduced click rates to an average of 4.1% after 12 months down from a global baseline of 33.1%. At the six-month mark, a realistic target is 60–70% below your pre-training baseline. These figures vary by sector, organisation size, and simulation frequency.
Why doesn’t security awareness training always work?
A 2025 controlled study involving 12,511 employees found no statistically significant reduction in click rates from training interventions. The critical distinction is programme design: passive, infrequent, or annual training rarely changes behaviour in a lasting way. Continuous, personalised, simulation-based training with immediate feedback has been shown to cut compromise rates significantly. Annual compliance-driven training is the version that consistently underperforms.
Should completion rates be used as a KPI for security awareness training?
Completion rates are valid as a compliance metric they confirm employees received training. They are not valid as an effectiveness metric. Updated federal cybersecurity guidance (NIST SP 800-50 Rev.1, September 2024) states directly that completion logs satisfy compliance requirements but do not prove risk reduction. Use completion rates to satisfy auditors. Use reporting rate and incident trend data to evaluate whether your programme is working.
What is the miss rate in phishing simulations, and why does it matter?
The miss rate is the percentage of employees who neither click on nor report a simulated phishing email they do nothing. It is the hidden risk in most SAT dashboards. A low click rate combined with a high miss rate may indicate that employees are not engaging with simulations at all, rather than that they are recognising threats. Tracking miss rate separately from click rate gives you a more complete picture of where your programme stands.
References
- 2024 Verizon Data Breach Investigations Report (DBIR) Summary
- NIST Special Publication 800-50 Rev.1: Cybersecurity Learning Programs
- Evaluating Phishing Training Inefficacy Using the NIST Phish Scale
- The Long-Term Impact of Continuous Phishing Training and Emotional Triggers
- IBM Security 2025 Cost of a Data Breach Report
- Categorizing Human Phishing Difficulty: The NIST Phish Scale